Embracing Growth as a Designer at CircleCI

We transitioned into a Growth focused team. As a product designer on the Activation team, here’s some growth processes I’ve learned and applied to how we run experiments, some experiment results, and becoming the first growth designer in the company.
Intro
Designers should care about Growth as it demonstrates the impact of design. Measuring the value of design is an ever-growing topic. And tools like Amplitude and Optimizely can help enable designers to understand and measure their impact. As a “Growth” embracing designer on a “Growth” embracing team, here’s some things our feature design and development included, taking in some of what we’ve learned about growth processes.
Some process
Goals and focus
It’s important to focus on a goal for growth. Why? Design generates impact and less impactful without. Experimentation is focused.
Know your goals, baselines and current numbers: Flying blind makes it difficult to pinpoint what’s happening in the ecosystem. And as the company scales, this problem will persist in larger ways. Our team identified a significant drop-off in user engagement during the initial setup phase, particularly due to configuration errors. Our key result is to increase % of new orgs that successfully attempt 1 Pipeline to 3 Green Pipelines from X to Y.
Pipelines are our name for the full set of configuration you run when you trigger work on your projects in CircleCI. Pipelines contain your workflows, which coordinate jobs.

Lex Roman says “when you're trying to move signups, retention, revenue, referrals, you have to laser focus on that thing. Now, as a designer, you may not be leading goal setting, but if your team is taking on five goals, you're not going to hit them. Being able to help your team focus on the high impact stuff is critical to success.”
Prioritization
Prioritize work that is going to drive your team towards its goal. It’s too easy for bugs, tech debt and other general clean up cards to become a distraction.
Investigation
Working with Analysts: Our Data Analyst discovered a relationship between the number of Pipelines an organization runs in their first week(s) for them to be engaged. At this stage we’re trying to understand config-related errors in first builds and to get a better read into why Pipelines fail. Data indicated errors around missing or invalid configuration files making up a large percentage. This becomes our beacon to explore.
Qualitative research: Speaking to users. We probed into project setup during qualitative research studies and heard how setup requires too many steps and configuration is hard. Findings from quantitative research aligned with findings from qualitative research sessions, whereby users hit errors activating their first build because their configuration file had issues with file paths, naming conventions, syntax errors, etc.

User journey mapping for users with different jobs such as developer, enables developers, and cares for infrastructure.
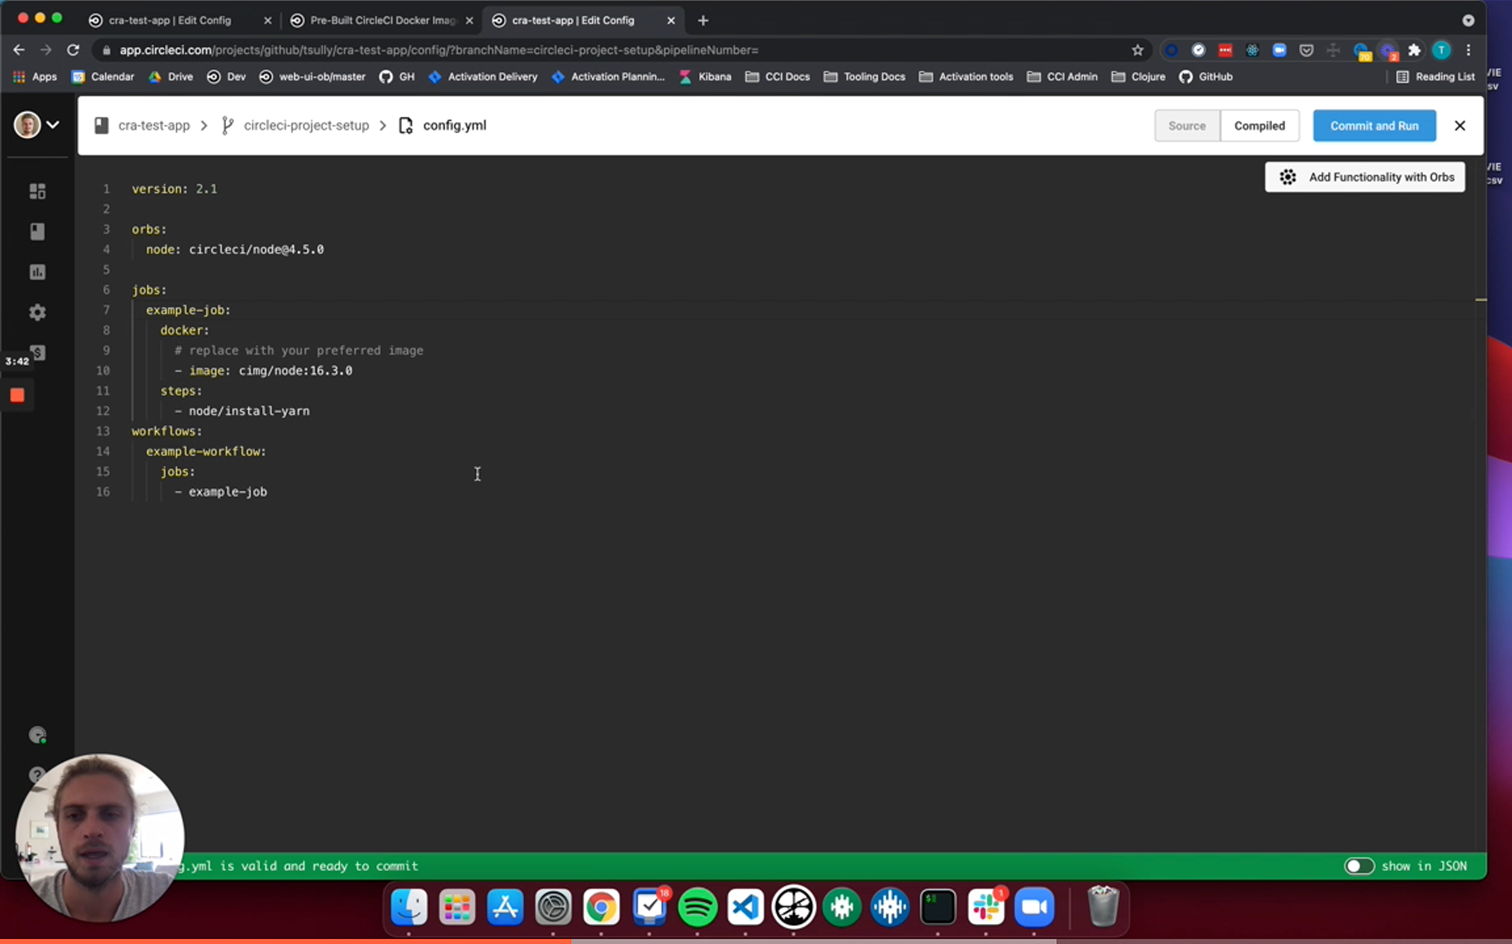
Activation problems: Project setup required action away from the product, and figuring out YAML spacing and syntax is confusing. I proposed enabling users to commit configuration files directly to their repositories from CircleCI, based on a shared insight from users, “If you’re going to show me a Start Building button, you might as well bring me all the way.” The idea is to remove unnecessary friction and make the path from setup to running pipelines as seamless as possible. Since this would be the first time CircleCI commits directly to a user's codebase, potentially sensitive action, we prioritized user testing to validate the approach. What we found was encouraging: the majority of participants were not only comfortable with the idea, but preferred it, provided the changes were committed to a separate branch. As one user put it, “if it goes to a different branch, that’s great.” Confirming that our solution strikes the right balance between automation and developer control.
Competitive research: Committing from app to a user’s codebase or VCS is not uncommon. We reviewed related workflows on other dev tools.
Brainstorming and backlogs

Team brainstorm to break down problems and understand root causes

Experiment backlog categorised into different areas of the user’s journey e.g. activation, engagement, retention, etc.
Ideas are backed up with data from qualitative and quantitative research. Every team member is encouraged to submit an idea and provide as much background data possible to help form a hypothesis. For example, our “good experiment” cards include:
Problem
Hypothesis
The idea is that if we can keep the user in one continuous onboarding flow where they find, add, configure, and start building their project without leaving the application, we believe that we can positively impact engagement, while also making activation much easier.
If we reach X% adoption, feature-name will result in X% improvement of orgs hitting 3 green Pipelines in their 1st week, our primary KPI.
Test sequence
Primary KPI
Open Questions

Example of an experiment brief
Design and ship

Scope: Limit scope of the feature. In our case, the new branch name and commit message were fixed. We choose the branch name for you so we don’t get into cases where users select an existing branch, and possibly one that has branch protection. Enable people to choose existing branches, edit commit messages, etc. in future versions.
Utilize existing components
Copy is important. Work with your copywriter.
Don’t design for every edge case e.g. 1 error modal to rule them all ;)
Hold off on localization
Polish later
Instrumentation: Name events and define attributes properly in Amplitude. Attribute descriptions are important. Consider not sending too much info to Amplitude in case it leads to things becoming messy. Set up the experiment in Optimizely and define your primary goals and metrics e.g. % of people that click “Add Config” button

Example: Add Config button did not perform as well as intended. An assumption could be made that users aren’t sure what it does so adding manually feels “safer”. A followup experiment could focus on Add Config education.

Example: Understanding how and where dots can work as a pattern for us to drive discovery
We scope the release to internal users to begin with, and later to a small percentage of all users. Optimizely worked great here as we could easily increment the percentage of users every other day, helping reach statistical significance.
Given we defined attributes in Amplitude, we can look at user journeys in the tool. Pathfinder charts are useful for us, as well as funnels to show user paths. Go into Amplitude and see what steps people have and have not completed. Casually exploring Amplitude doesn’t offer many clues. Dig with specific questions in mind.
Monitor: Monitor Twitter and support channels for any mentions of incidents or unexpected behaviour.

Measure and impact
Measuring allows us to:
Understand which levers are impacting our top line metrics and to what degree
Test a feature or experience on a small sample size before going all-in
Be data-driven, removing opinions and emotions
Promote learning and failing fast so that innovation happens quickly
Work with your PM and Data Analyst to reveal impact so far. Teams should do data reviews regularly. Pause and make sure people know what’s going on data-wise. Present to the team and document discussion to feed into next steps.
Some experiment results
🔼 43% increase in users activating their first pipeline after signing up
✅ 150% improvement in the success rate of an organization's first pipeline
🚀 56% adoption rate for our new in-app commit feature and code editor
🚫 47% reduction in build failures caused by misconfigured YAML files
📚 33% increase in documentation engagement and 🆕 8% uplift in signups originating from documentation pages

🔼 43% increase in users activating their first pipeline after signing up by better guiding users to set up their project, suggesting a configuration file specific to their project during the experience, instead of relying on users to leave the product to find one themselves in docs or elsewhere.

✅ 150% improvement in the success rate of an organization's first pipeline by introducing a code editor into the onboarding flow for users to commit a configuration file directly to their code repository. Avoiding users leaving product to do so themselves. As part of this we also rewrote our offering of configuration files so they’re easier to understand and consistent. A learning from user interviews.
🚀 56% adoption rate for our new in-app commit feature and code editor. This was a strong win, particularly given early skepticism amongst teams. Many believed adoption and impact would be limited, assuming users would stick to their local code editors. Data and user feedback proved otherwise.

🚫 47% reduction in build failures caused by misconfigured YAML files by making our code editor accessible within the core product of June, and not just during onboarding. Code validation helped a lot here, and guiding users through code customization.


Design iterations of a configuration builder ☝️ Given industry trends and the success of our code editor experiments, we proved that a creating a configuration builder is feasible and the work can be broken into smaller chunks, creating a starting point for precise and productive conversation internally. Focusing on problems from user research:
New orgs have diverse and complicated needs early on
The “build and test” happy path does not work for orgs most likely to pay us
Users really struggle starting a configuration from scratch
Lack of support during setup leads users to seek unverified resources
Users think in terms of "jobs" and know what jobs they want to do
Users aren’t afraid of Orbs they just don’t know how to use them
Project setup extends far beyond our project setup
Most users feel YAML is hard

📚 33% increase in documentation engagement and 🆕 8% uplift in signups originating from documentation pages by restructuring documentation and guides to focus on helping users get up and running with project configuration faster. We also invested in improving guide content for our most popular languages, ensuring clearer and more relevant onboarding paths for activation.